I just finished reading Paul Murrel's book, "R graphics".
There are two graphical systems in R: the old ("classical" -- in the "graphics" package) one, and the new ("trellis", "lattice", "grid" -- in the "lattice" and "grid" packages) one.
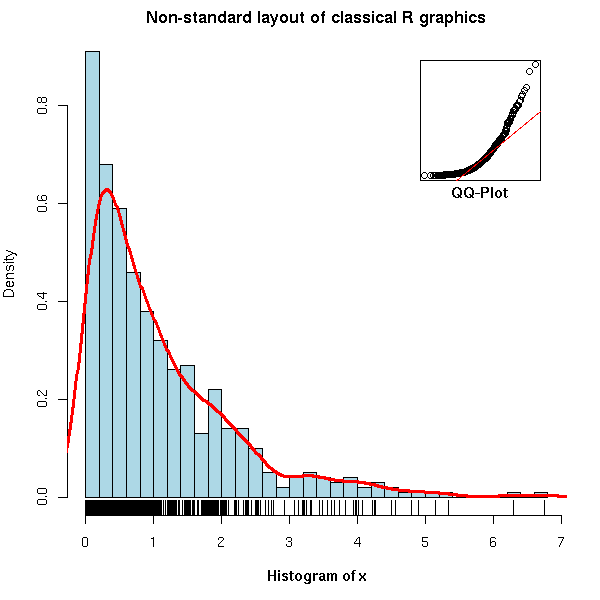
The first part of the book, devoted to the old system, tries to be as complete as a reference book, but fails. For instance, the discussion on how to arrange several plots on a single page sticks to tabular layouts and fails to mention the more flexible "fig" graphical argument (to be honest, it is listed with terser explanations than in the manual page and also appears, deeply hidden in an example, in an appendix).
op <- par(mar = c(5,4,2,2))
N <- 500
x <- rexp(N, 1)
hist(x,
     breaks = 30, probability = TRUE,
     col = "light blue",
     xlab = "",
     main = "Non-standard layout of classical R graphics")
mtext(text = "Histogram of x",
      side = 1, font = 2, line = 3)
lines(density(x),
      col = "red", lwd = 3)
rug(x)
par(new = TRUE,
    fig = c(.7, .9, .7, .9),
    mar = c(0,0,0,0))
qqnorm(x,
       axes = FALSE,
       main = "", xlab = "", ylab = "")
box()
qqline(x,
       col = "red")
par(xpd = NA)
mtext(text = "QQ-Plot",
      line = .2, side = 1, font = 2)
par(op)
On the other hand, the second and largest part, devoted to grid graphics lives up to my expectations: it seems more complete and does not duplicate information already available on the web. You are probably already familiar with some of the high-level lattice plots (xyplot(), histogram(), bwplot()), but if you have already tried to understand how they are implemented, or tried to write your own graphical functions, you were probably confused by the differences (and claimed lack thereof) between "lattice", "panel", "grob" and "grid" -- the book clarifies all that.
The code of the examples in the book is available on the author's web site.
http://www.stat.auckland.ac.nz/~paul/RGraphics/rgraphics.html
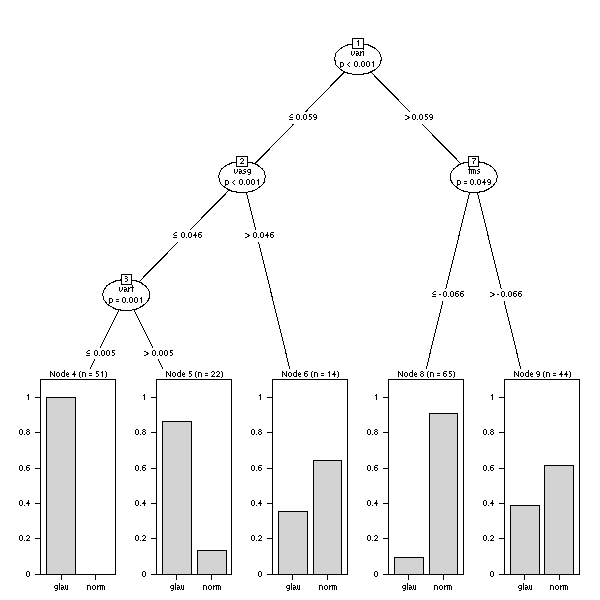
You will find, for instance, dendrograms (check the rpart and maptree packages),
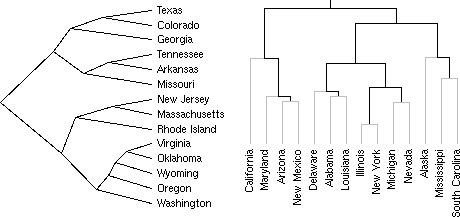
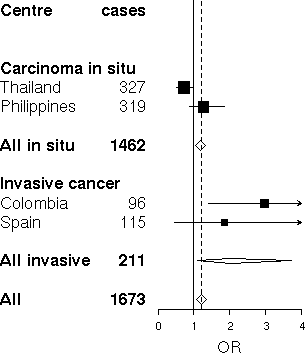
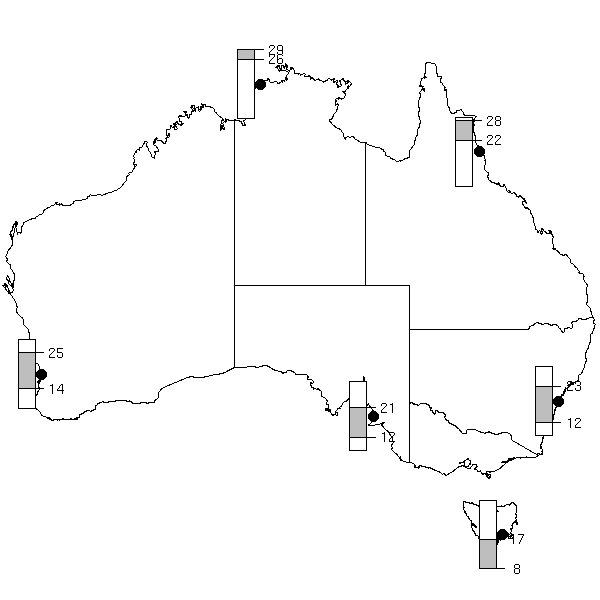
table-like plots
or plots arranged in a tree (this can be seen as a generalization of lattice plots, that present several facets of a dataset arranged on a grid).
One whole chapter is devoted to the creation, from scratch, of an oceanographic plot
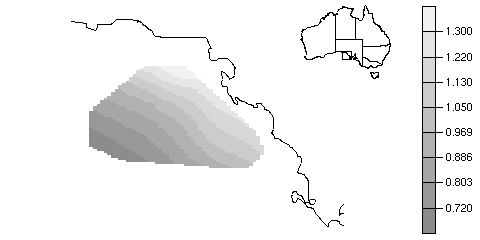
whose elements are then reused for a completely different plot.
posted at: 01:48 | path: /R | permanent link to this entry
