I did not attend the conference this year, but just read through the presentations. There is some overlap with other R-related conferences, such as R in Finance or the Rmetrics workshop.
http://www.agrocampus-ouest.fr/math/useR-2009/
http://www.rinfinance.com/
http://www.rmetrics.org/meielisalp.htm
Here are some more detailed notes.
Year after year, there are fewer and fewer examples that boil down to a simple linear regression: they are replaced by non-linear (sometimes non-parametric) and/or hierarchical linear (or survival, logictic, Markov, spatial, even spatio-temporal multiscale (country/micro-region/region)) penalized models, sometimes with added boosting or a bayesian prior; some presenters use the bootstrap to have more robust confidence intervals.
Examples included: Non-linear models in biochemistry, to estimate drug interactions, dose-response curves; Shape analysis; Text mining (for gene names in biology); Meta-analysis (aggregating several studies, e.g., with microarray data); Time series (building a business cycle (recession) indicator from NBER data: transform and/or filter the data, use non-linear and/or Markov switching (MS) models); Forecasting multivariate time series (to optimize a frozen goods supply chain or forecast electricity comsumption); Multivariate analysis (with FactoMineR); Design of experiments (DOE), survey design (compute the sample size, in each stratum, for a given desired precision, to estimate fisheries revenues); Subject randomization (subjects for a randomized trial arrive one by one; we then learn in which strata (gender, age, etc.) they are; we decide to give them treatment A or B by flipping a coin; we can hasten the convergence by keeping a running difference nA - nB for each stratum and using a biased coin to redress any unbalance).
The large-scale ThomasCook example was interesting. They store the data in an SQLite table (modified to hold 30,000 columns -- with PL/R, they had ended up writing R code that called PostgreSQL that called R: it was a nightmare to debug) and use R for ETL (Extract, Transform, Load), with some Python (BeautifulSoup) for screenscrapping: glmpath to select the variables; randomForest (on the selected variables) to predict the speed at which the planes will fill. The prices are optimized with the random forest model and a fuzzy inference engine (based on the sets package) prevents canibalization (you lose clients to yourself) and allows the business to add their imput to the model. They provide a graphical interface with wxPython/RPy2 (and py2exe to create Windows executables that do not require Python on the clients); R remained on a central server (some call it SaaS: Software as a Service).
Kaleidoscope plots are those impressive, dense, polar coordinate plots, judiciously using transparent colours, you sometimes see in bioinformatics, often produced by Circos (GPL, unrelated to R). There was one on the title page of the article "Beautiful code, Compelling Evidence", (which explains how to use Haskell and OpenGL to produce graphics).
http://mkweb.bcgsc.ca/circos/
http://www.renci.org/wp-content/pub/tutorials/BeautifulCode.pdf
The basic idea stems from the graph layout problem: if you are completely clueless about how to plot a graph, just put the vertices in a circle; if the graph is weighted, draw the edges as varying-width ribbons;
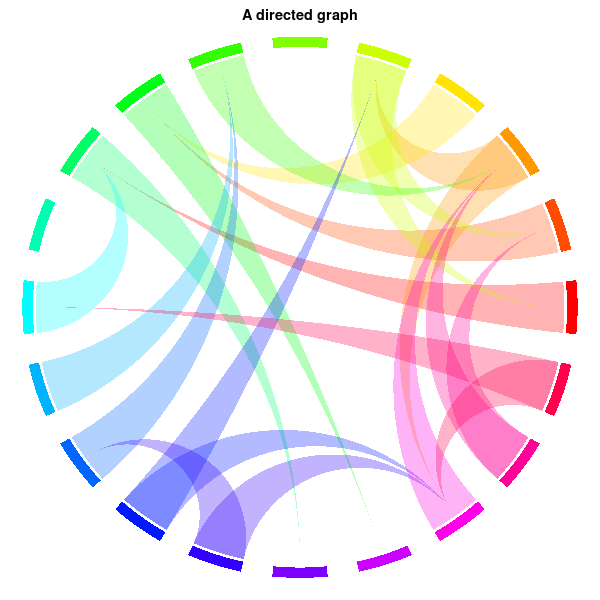
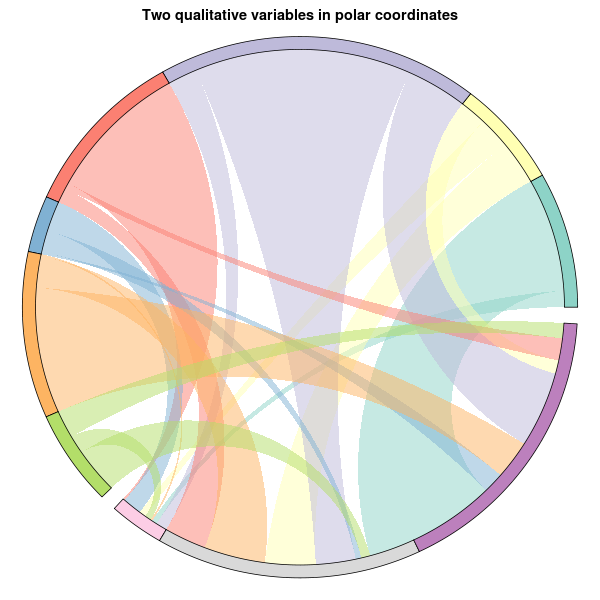
finally remark that a contingency table is a (bipartite: rows and columns) weighted graph
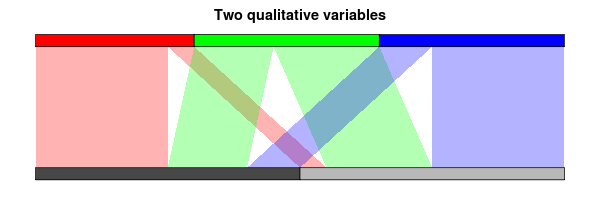
and draw it in polar coordinates (pay attention to the order of the segments and the ribbons, label the segments, add axes). Use it if you want artistic plots (that make the user wonder what the plot is about) or if your data is too large to be amenable to more traditional plots.
Visual analytics are statistical graphics made by artists or good communicators: they should capture the audience's attention and convey the speaker's ideas. The most salient such example is GapMinder (a flash-based application to display multivariate time series, as animations) and its narrative power (it helps you efficiently tell a story, but might not be the best tool to discover that story). As statisticians, we can try to reduce the information displayed to what is relevant and add model information (distribution, prior, expected values under H0, etc., for instance a map of cholera cases can be complemented by well positions and their Voronoi tessellation). R provides graphics for diagnostics, presentation (but no animations or interactivity), and not much for data exploration (iplot, iplot eXtreme, ggobi) -- redundant functions do not help (for instance, you can draw a histogram in any of the following ways: hist, truehist, histogram, qplot(...,geom="histogram"), ihist).
http://www.ted.com/talks/hans_rosling_shows_the_best_stats_you_ve_ever_seen.html
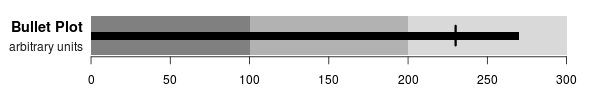
An information dashboard (ID) presents all the information needed in a single, easy-to-read page; it can use bargraphs, stacked bargraphs, linegraphs, scatterplots, boxplots, sparklines, treemaps, bullet graphs (a thick horizontal line from the origin to represent a single value, with a tick for a reference point (target, last year's value, etc.), and a coloured background to represent how good the value is (3 values, from dark (bad) to light (good) grey; do not rely on colours); do not forget a textual label, with units (smaller), and a scale)
and horizon plots (to plot a time series, represent both positive and negative values above the axis, with a different color (blue/red), put the possible values into three bands, of darker colours, and overlay them) -- of course, no piecharts.
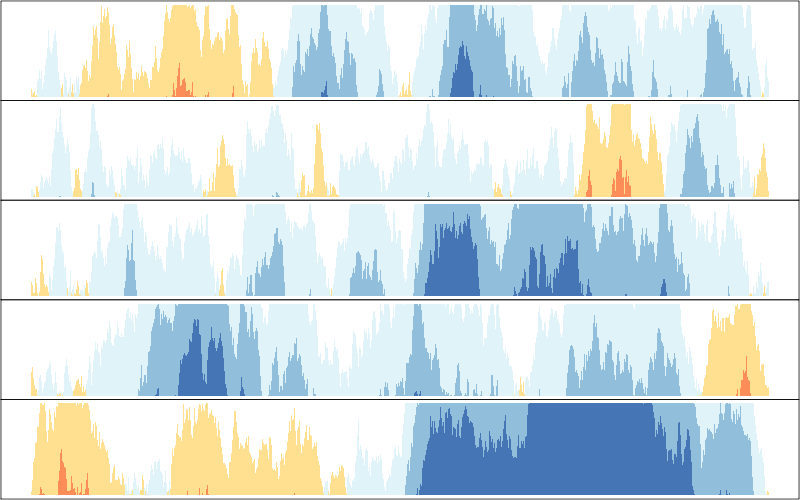
Bullet Graphs
http://www.perceptualedge.com/articles/misc/Bullet_Graph_Design_Spec.pdf

Horizon Plots
http://www.perceptualedge.com/blog/?p=390

Pie Charts
http://www.perceptualedge.com/articles/08-21-07.pdf
The iPlot package adds interactive graphics to R, but cannot be used for large datasets: there is no OpenGL in Java and the data is duplicated between R and the JVM. The soon-to-be-released iPlot eXtreme, in C++, should address those problems.
The PairViz package uses graph and igraph to order the variables in a parallel coordinate plot using graph-based algorithms (hamiltonial or eulerian path); this can be combined with scagnostics if there are many variables.
R can be linked to external visual exploratory analysis tool: ggobi, Visplore (opensource, but early alpha), etc.
To plot the results of a clustering,
bwplot( value ~ variable | cluster )
you can add a reference point (the global average of each variable), fine-tune the order of the clusters, of the variables, highlight important variables (or grey out unimportant ones -- this will depend on the cluster).
Multiple testing often assumes the tests are independent and then controls the family-wise error rate (FWER, probability of having at least one wrongly rejected null hypothesis), the false discovery rate (FDR, proportion of wrongly rejected null hypotheses) or the false non-discovery rate (FNDR, proportion of wrongly non-rejected null hypotheses). If you simulate data similar to yours, you can have an idea of the distribution of the FDR and FNDR and see how it changes as the correlation of the data increases. It is possible to include some knowledge of the corelation structure into the testing procedure: these ``factor-adjusted test statistics'', implemented in the FAMT package (factor analysis for multiple testing), can improve both FDR and NDR.
When estimating a p-value by Monte Carlo simulations (bootstrap, permutations, etc.), some people do not want the p-value but are happy with just knowing if p <= alpha for some predefined threshold alpha. In this case, we can do with slightly less data (than if we wanted p, i.e., all values of alpha) by looking at the path cumsum(T) of partial sums of the test statistic and checking if it remains in or leaves some box- or tunnel-shaped region (sequential Monte Carlo p-values).
The car::Anova function implements nested linear tests (type II tests, i.e., tests of H1|H2, where H1 => H2) and unconditional linear tests (type III tests) with an F statistic.
When comparing the two models y ~ x and y ~ treatment + x, where the treatment is a binary variable, some people like to have two observations for each possible value of the covariates, one for each value of the treatment. This is usually not the case, but we can instead ``fabricate'' new observations: matching is very similar to regression, but it is not linear (it could be seen as a ``non-parametric regression developed by non-statistitians''). This also looks like an imputation (or inference with missing data) problem, but it is apparently addressed with ad hoc methods: coarsened exact matching (CEM) is just one of them -- there are 10 matching packages for R... An application to program evaluation (``program'' means sanitation improvement, etc.) was presented.
Penalized estimators (such as non-parametric regression) are good but biased by construction: you can try to estimate and reduce the bias; the ibr package implements such an iterative bias reduction -- but there were too few details in the presentation.
Penalized regression minimizes
RSS + sigma^2 * k * lambda,
where RSS is a sum of squares, k is the model size, and lambda the penalty for complicated models. AIC (Akaike information criterion) uses lambda=2 but overfits large datasets; BIC (bayesian information criterion) uses lambda = log n. Adaptively penalized regression minimizes RSS + sigma^2 phi(k,n), where phi is motivated by the FDR (false discovery rate), i.e., the expected number of wrongly rejected H0 in a multiple test (it has a higer power than the too conservative FWER (family-wise error rate), which controls the probability of one or more incorrectly rejected H0; with the FDR, you do not have a single p-value, but a sequence (for the first, second, etc. test): p/m, 2q/m, 3q/m).
A full regularization path (i.e., a penalized estimator, not for one but for all values of lambda: lasso, with its L^1 penalty; ridge, with its L^2 penalty; elastic net, with both) can be efficiently computed by coordinate descent (discretize the path, estimate one coordinate at a time until convergence, repeat for the next point on the path, etc.). Coordinate descent should work any time your optimization if of the form something + lambda * penalty, for instance to build undirected graphical models (it gives you a sequence of graphs) or to complete a matrix (e.g., a movies * ratings matrix, not observed completely).
In credit rating, to estimate the probability of default, you can replace the (linear) logit model by a generalized additive model (GAM). (There are (too) many such estimators in R, not only gam and mgcv; if you hesitate, use gam (more stable for small datasets), unless you have a lot of relatively clean data.)
The Influence.ME package provides regression diagnostics (influential observations, etc.) for mixed models; the merBoot package uses bootstrap to provide empirical p-values for mixed models.
The nlstools package provides a few functions to help fit non-linear models: to help you (graphically) choose the starting values; to fit the data; to display the data and the fitted curve.
To estimate the mode of unimodal data, you can compute density estimators with wider and wider kernels, look at their local maxima and remember their positions when they disappear: you get a dendogram-like plot -- this can actually ge generalized to higher dimensional data (apply some dimension reduction algorithm afterwards, if needed): check the denpro and delt packages.
The DTDA package provides functions to analyze truncated data (estimator of the cumulated distribution function (cdf), etc.).
The fitdistrplus package helps you fit distributions (as MASS::fitdistr), but allows for censored observations, provides skewness/kurtosis plots (with the dataset, bootstrap replications, and the regions attainable by the models you are considering) and goodness-of-fit tests (Anderson-Darling test to compare the data and the fitted model -- it accounts for estimated parameters).
The mhurdle package generalizes the Tobit model
y1  = beta * x + epsilon
y0  = y1 * ifelse(y1>0, 1, 0)
to multiple hurdle models
y  = beta * x + epsilon
y0 = y1 * ifelse(y[,1]>0 & y[,2]>0 & ... & y[,n]>0, 1, 0)
The mlogit package fits multinomial logit models (wasn't there already an implementation in nnet::multinom?).
Markov Switching models can be fitted by expectation maximization (EM): estimate the state at each time; then the parameters in each state; iterate.
You can mine a large number of time series by computing a few metrics for each of them (average, volatility, minimum and maximum of the derivative, etc. -- use the methods of functional data analysis (FDA)) and plot the resulting multivariate dataset (1- or 2-dimensional plots, PCA (principal component analysis), etc.). This is the idea behind scagnostics, applied to time series.
In a threshold autoregressive model (TAR) model, the autogression (AR) coefficient depends on the previous value (often, one allows two values depending on the sign; sometimes three values corresponding to ``significantly positive'', ``significantly negative'', ``small''). The idea can be generalized to threshold cointegration: two time series are threshold cointegrated if they have a threshold stationary linear combination y, i.e.,
t(t+1) = alpha(y(t)) y_t + epsilon(t+1)
with
alpha(y(t)) < 1 if y(t) is large
The Kalman filter can be robustified to resist to either outliers or regime changes (or even both, but with a delay) with the rLS and ACM algorithms.
With the seewave package, R can process sound samples (the plots are nice and the PDF presentation even contained an animation) -- of course, since R tends to store data in memory, this is only limited to sound samples.
Breakpoint models are used in bioinformatics to model the ratio
number of copies of a gene / number of copies in the reference
as a locally constant function of the position on the chromosome; the breakpoints can be estimated with dynamic programming -- could dynamic programming be applied to other breakpoint problems? I rarely see it outside bioinformatics.
The usual RMetrics presentation(s) focused on date arithmetics (the timeDate and timeSeries packages are aware of weekdays, businessdays, for a given financial center) and portfolio optimization.
The GeoXp package provides a few plots for spatial data: driftmap (not defined), angle map,
f(x1)-f(x2) ~ angle(x2-x1)
where the angle is with respect to the horizontal axis), neighbourhood map (number of neighbours versus distance to the nearest neighbour), Moran plot (to check for spatial autocorrelation, plot the value of the variable of interest at a point versus the average value in a neighborhood of this point -- you could also use two different variables), outliers (Mahalanobis distance between pairs versus Euclidian distance between pairs); those plots could be be linked to a map.
To the list of multidimensional scaling algorithms, cmdscale, isoMDS, sammon, you can add isomap, which tries to find a (non-linear) 2-dimensional submanifold, smooth but close to the data. As always, try all algorithms and try to replace the dissimilarities by their ranks (it does not matter if the matrix is not metric).
The biclust package implements many biclustering algorithms (for binary, quantitative, ordinal or qualitative variables).
Hierarchical clustering can be performed on principal components (some claim that discarding the last factors of a factor analysis makes the clustering more robust, others claim the opposite); the clusters can be defined by representative individuals (actual data points), variables (as in biclustering) or axes (as in a biplot).
fMRI data can be analyzed through spatial and even (spatio-)temporal ICA (independent component analysis) if you have a sparse description of the singular value decomposition (SVD); also check the PTAk package for principal tensor analysis -- a similar idea was presented a few years ago at SigGraph.
Out-of-Core Tensor Approximation of Multi-Dimensional Matrices of Visual Data
http://vision.ai.uiuc.edu/~wanghc/research/siggraph05.html
Canonical correspondance analysis (CCA) and partial least squares (PLS) are very similar: the former looks for linear combinations a'X and b'Y of X and Y that maximize Cor(a'X,b'Y), the latter maximizes Cov(a'X,b'Y). Both can be regularized: the ridge (replace (XX')^-1 with (XX'- lambda I)^-1) is popular with CCA, the lasso (an L^1 penalty) with PLS.
Data envelopment analysis (DEA, , the construction of efficient frontiers in the input * output or risk * reward space) can use CCA as a first step, to select the variables to use; beware of outliers: DEA focuses on extremes. DEA can also be applied to medicine.
Distributed quantile estimation (compute a few quantiles on each client, convert them into an estimated cumulated distribution function (cdf), send it to the server which then averages those cdfs to estimate the quantiles) can be generalized to higher dimensions with PCA (only compute the quantiles on the first principal components); this idea can be applied to monitoring (e.g., to spot when a coffee machine is about to run out of coffee by listening to it).
Multiple tests and variable selection can be improved by accounting for correlation (with a correlation-adjusted T-score). For instance, in genetics, you can group genes in the same pathway (or, if you do not have this information, in the same correlation neighbourhood). For feature selection, you should control the FNDR (false non-discovery rate) rather than the FDR (false discovery rate).
Several presentations focused on multiple imputation: exploring/visualizing the structure of missing values with the VIM package (there is also a GUI); fixing the separation problem (more variables than observations would remove all the randomness from the imputation procedure) by adding a bayesian prior with the mi package.
The partykit package unifies the various tree packages (rpart, knnTree, Rweka, party, randomForest, gbm, mboost) and should facilitate the implementation of other algorithms; it also provides a PMML interface (PMML is an XML file format to exchange statistical models between applications, mainly used in data mining).
Random forests are not only used for prediction or feature selection, but also to measure how important each variable is; contrary to univariate measures, they can take interactions into account. The permutation importance of X_j is the average decrease in classification accuracy after permuting X_j. This is problematic because a variable can appear important because it is independent from the variable to predict, or just from the other variables. Conditional permutation importance (implemented in the party package) can help focus on the former.
The standard benchmark to measure the performance of a tree algorithm is C4.5 -- its licence does not allow you to use it, but it has been reimplemented as J4.8 in Weka, available through RWeka. Other algorithms include: CART (classification and regression trees) in the rpart package; unbiased recursive partitioning (QUEST in the LohTools package) and conditional inference trees (CTree in the party package). They all perform well, except C4.5/J4.8 without cross validation (cross-validation improves all those algorithms and is already included in some of them: if not, do not forget to add it).
Classification trees (CART, in the rpart package) can be generalized to a multivariate gaussian outcome.
After a hierarchical classification, one usually cuts the dendogram, but you do not have to do it horizontally -- permutation tests can help you find a good, non-horizontal cut.
While the graphical model R packages landscape is getting less empty, it remains more heterogeneous than other domains, and is still plagued with external, Windows-only and/or closed source solutions, rarely useable in a professional context: WinBugs, MIM, Genie/Smile (closed-source, but free to use, even commercially), etc. Here are a few examples besides the classical gR (actually a combination of several packages) and gRbase: the ReBaStaBa package describes an already constructed bayesian network (bayesian networks provide a concise description of a joint distribution); the IdR (influence diagrams in R) package, can apparently learn the graph structure from the data (but there were too few details in the presentation).
Graph (or link) data abound, from the web (links between Wikipedia articles) to linguistic databases. An ontology is a list of words, with links between them; contrary to a taxonomy, those relations are not limited to speciation/generalization but can be arbitrary complicated; polysemy and synonyms are often prohibited (to avoid the mess of gene and protein names); ontologies can be used to represent knowledge and make deductions (an ontology can be seen as a graph theorist's reinvention of Prolog). OWL (Web Ontology Language) may appear powerful, but is not robust at all; good old RDF (resource description language: it lists triplets (subject, predicate, object), or equivalently (node1, edge type, node2), i.e., describes a graph with coloured edges -- contrary to OWL, it does not allow for constraints on the predicates such as cardinality, transitivity) is sufficient for most practical purposes.
The igraph and pagerank packages provide graph-theoretic algorithms; for instance, they can be used to create a tag cloud using multidimensional scaling (MDS) for the positions. You may also want to check Wordle, which takes the shape of the words into account, or Many Eyes's bubble chart, which uses a circle packing algorithm and amounts to a square root transform.
Tag-cloud Drawing: Algorithms for Cloud visualization
http://arxiv.org/abs/cs/0703109

http://www.wordle.net/

http://manyeyes.alphaworks.ibm.com/manyeyes/page/Bubble_Chart.html
The sna package (social networks) can be combined with the tm package (text mining) to analyze mailing lists.
The result of a centroid-based clustering algorithm (k-means, PAM (partition around medoids), etc.) can be assessed with the silhouette plot,
d(x,c2(x)) ~ d(x,c1(x)),
where c1(x) and c2(x) are the centroids closest and second closest to obervation x; or neighbourhood graphs, weighted graphs with the centroids as vertices and the weight between c1 and c2 is the number of points x such that c1(x)=c1 and c2(x)=c2 or the average mean average distance.
The gcExplorer package relies on Rgraphviz, graph and symbols (to add plots (barplots, etc.) in the graph vertices) to display these, interactively.
Association rule mining can be seen as a form of ``non-symmetric correspondance analysis'' for binary data: it can rely on brute force or multiple correspondance analysis (MCA); some algorithms also use exogenous data (e.g., socio-demographic data for a client * item dataset).
The set package provides (finite) set operations, that can easily be generalized to fuzzy sets (just replace the topos of truth values {0,1} by the interval [0,1]); applications include relations (order, partial order, equivalence, etc.) and how to average them (e.g., voting systems) -- this leads to non trivial optimization problems.
The TopkLists package implements algorithms to average ordinal data, i.e., rankings, when m raters provide the top k elements in a list of N (more voting systems).
Surprisingly, R is sufficiently fast to simulate dynamical systems (e.g., in ecology), i.e., large systems of differential equations, with the following packages: desolve (rather than odesolve, which could only tackle small/toy problems) for dynamical systems; rootSolve for the steady state solution; linSolve for least square solutions (when your linear system is undetermined, just add Min x^2 to turn it into a quadratic program); simecol for applications in ecology.
Bigmemory, which uses the Boost C++ interprocess library, paliates the lack of multithreading in R through shared memory or file-based matrices; it also provides iterators to hide (or make implicit) the parallelism provided by multicore, snow, nws. Also check ff (matrices limited to 2^31-1 elements), ffdf (as fast as bigmemory), sqlite (sufficiently fast), BufferedMatrix (inefficient), filehash (sufficiently fast).
RCpp allows (eases) the use of C++ and STL containers; conversely, RInside allows you to call R from C++; also check rdyncall to use C libraries from R.
Several packages provide some parallelism: multicore; snowfall, nws, Rmpi; gridR. With parallel computations, beware of random number generators: the random numbers on each node should look independent.
Threads (as opposed to parallelism) are needed to process real-time (streaming) data. R will remain mono-threaded for the foreseable future; in the meantime, use several process (with some C/C++ where needed) and shared memory (with bigmemory) between processes.
R can be used in simple web applications (the user fills in a form and a plot is updated), thanks to the RApache module, with some Ajax, XML or JSON (better than XML for large datasets), and hwriter (but for static HTML reports, I prefer Sweave).
RdWeb is (may become) a web interface to parallel computing in R (RApache and Rserve do not focus on parallelism); it requires a batch system (at, openPBS, Torque, etc.)
A task scheduler is a hybrid between make and at/crontab: it automatically executes tasks after a given time, when some conditions (file availability, etc.) are met and allows tasks to be dependent on one another (you can write a quick and dirty task scheduler with make and crontab: from the crontab, launch make -k -j 100 in a directory every minute; tasks simply fail if their starting conditions are not met; track which tasks have run or are currently running by creating empty files with predefined names). The Coalition task manager (in Python, with Twisted Matrix, on GoogleCode) handles dependencies, load balancing; it does not seem to provide repeated tasks (``every day''), or tasks starting after a given time. There is nothing specific to R (and there should not be): it just launches executables, which can be R scripts.
A workflow engine allows you to write (the equivalent of) Makefiles (i.e., describe dependencies between tasks) graphically and run them on a grid, such as Knime, which focuses on data pipelines: it provides all the operations you can want on tables of data, the most common data mining algorithms and plots (Weka), and interfaces with R and BIRT (a J2EE reporting system).
The Nimrod toolkit combines a workflow system (Kepler), a design of experiments framework (DOE, more precisely ``computer experiments'', whatever that means -- simulations?) and gaussian processes (with the mlegp package).
Biocep-R is a javaesque application server: huge, exhaustive, unwieldy and fully buzzword-compliant.
The hive package uses Hadoop (a distributed computed framework, with a distributed file system, trying to run the computations near the data, initialy developped by Yahoo and currently maintained by the Apache foundation) e.g., for text mining tasks (with the tm package).
Most of those cloud computing frameworks (Amazon EC2, etc.) can generate or use models in the PMML format (designed to exchange statistical models between applications).
JEdit can be used as an IDE for R (many people advise Eclipse/StatET): it interfaces with the codetools package (warnings are presented as spelling mistakes would be in a text editor); provides a tree view of the code (based on the R parser), completion popups (for colours or plotting symbols, you have the actual colour or symbol), an object browser, a debugger.
The building blocks for SciViews (an R GUI) are available as individual, reuseable packages; some were used to build other GUIs such as Zoo/PhytoImage, an R-based graphical software for image analysis; it also uses the ImageJ image processing Java library (public domain).
Mayday is a visualization platform (in Java, interactive, aware of meta data, with the ability to write plugins) for numeric matrices; it now has an interactive R shell, based on RLink, a replacement (or a layer above) rJava.
Many mentions of rcom and statconnDOM (R--C\# link) to interface R and Excel (there is even a book on the subject -- frightening) or generate powerpoint files.
In many domains, R provides very similar functions in different packages each with its own syntax. Some (well needed but) isolated unification works have begun, for instance Zelig (statistical models), partykit (recursive partitioning algorithms) or optimx (for optimization: it provides a single interface and compares the various algorithms, to help the user choose the best for the problem at hand).
Instructional presentations included sparse matrices with the Matrix package (used for linear mixed models by lme4) and spatial autocorrelated (SAR) models; S4 classes (the dispatch is based on the type of all arguments, not just the first as with S3 classes); implementing new statistical distributions (the dpqr functions, and a few others), as exemplified in the distr and VarianceGamma packages, with some good general software engineering advice.
Provenance tracking tries to answer the question ``where does this variable come from? how was it modified?''; it is implemented in CXXR (a C++ reimplementation of R, designed to easily produce experimental versions of the R interpreter): the pedigree function is similar to history, but the audit trail it returns only gives the commands that affected a given object. The Open Provenance model aims at provenance tracking across systems.
Reproducible computing can be easily obtained by recording (``blogging'') everything you type, including outputs and plots, in a way reminiscent of Maple worksheets. Social data networks (Many Eyes, Swivel, TheData.Org, etc.) (but they often present pure coincidences as hard evidence).
2009-10-12_UseR2009.pdf
posted at: 19:18 | path: /R | permanent link to this entry
