Here is, as every year, an overview of some of the papers and books I read this year. The main topics are causality, explainability, uncertainty quantification (conformal learning), and data-centric machine learning.
posted at: 10:39 | path: /ML | permanent link to this entry
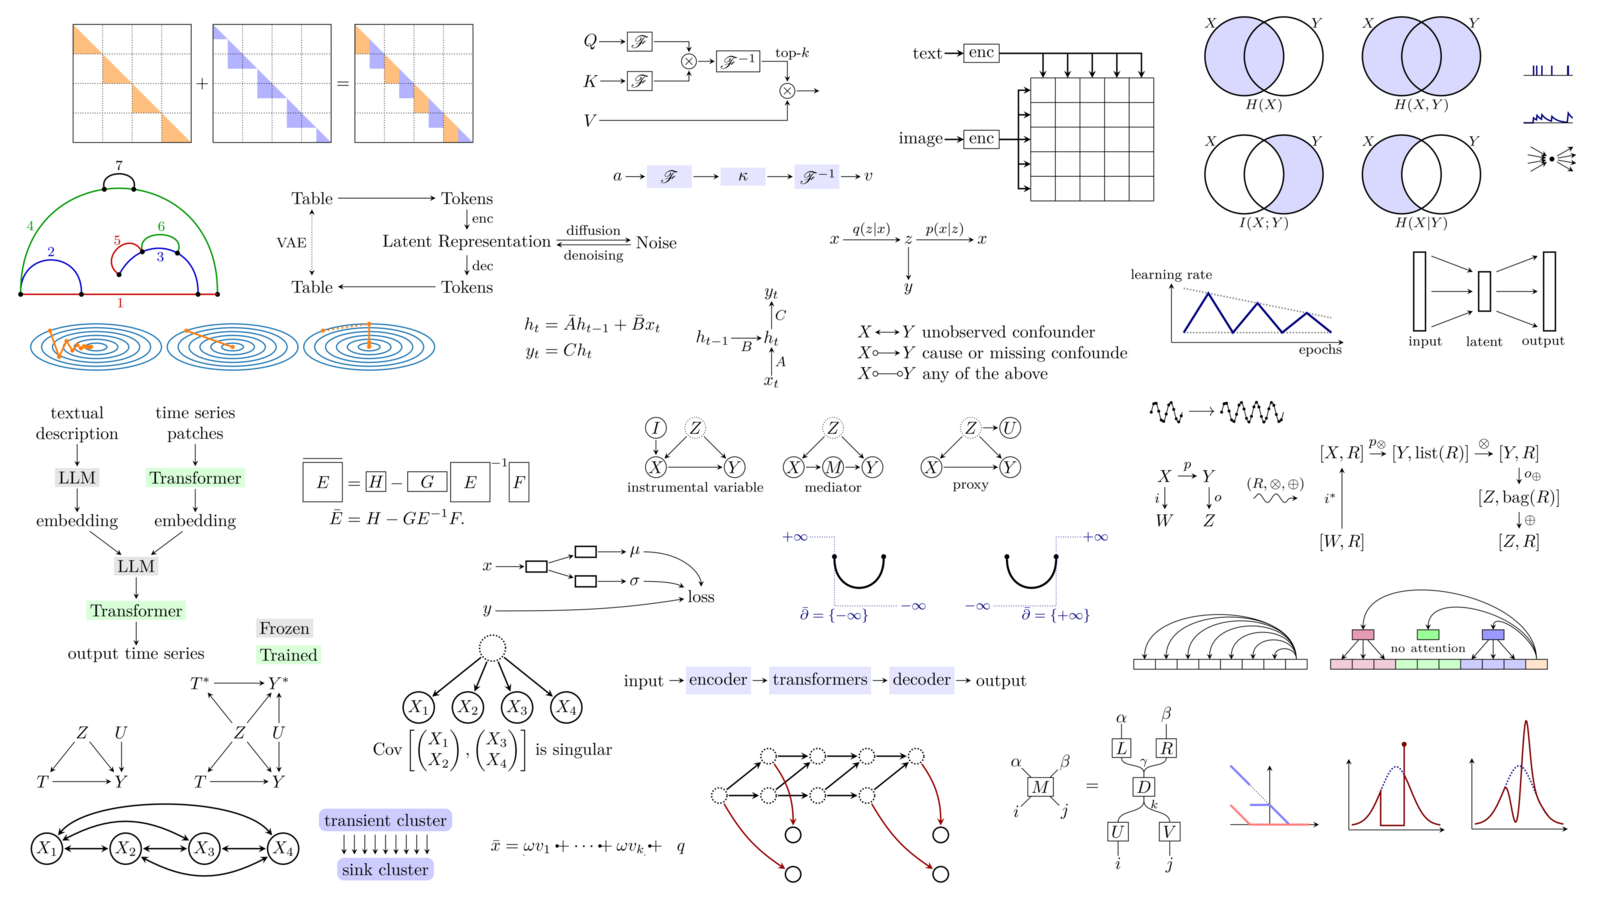
Here is, as every year, an overview of the papers and books I read this year. The main topics are transformers, graph neural nets, optimization, differentiability and time series.

posted at: 17:32 | path: /ML | permanent link to this entry
As every year, here is a list of what I have read and found interesting this year in machine learning.
Several topics escaped the machine learning world and also appeared in mainstream news: generative models, with Dall-E 2 and stable diffusion, and transformers, with ChatGPT.
Other topics, not in the mainstream news, include graph neural nets, causal inference, interpretable models, and optimization.
If you want a longer reading list:
http://zoonek.free.fr/Ecrits/articles.pdf

posted at: 15:26 | path: /ML | permanent link to this entry
As every year, here are some of the papers I read this year, covering topics such as copulas, convex and non-convex optimization, reinforcement learning, Shapley score, loss landscape, time series with missing data, neural ODEs, graphs, monotonic neural nets, linear algebra, variance matrices, etc.
If you want a shorter reading list:
Reinforcement learning
https://papers.ssrn.com/sol3/papers.cfm?abstract_id=3554486

ADMM
https://arxiv.org/abs/1909.10233

Copulas
https://link.springer.com/book/10.1007/978-3-030-13785-4
If you want a longer list:
http://zoonek.free.fr/Ecrits/articles.pdf

posted at: 11:16 | path: /ML | permanent link to this entry
As every year, here is a list of the papers, books or courses I have found intersting this year: they cover causality, alternatives to backpropagation (DFA, Hebbian learning), neural differential equations, mathematics done by computers, artificial general intelligence (AGI), explainable AI (XAI), fairness, transformers, group actions (equivariant neural networks), disentangled representations, discrete operations, manifolds, topological data analysis, optimal transport, semi-supervised learning, and a few other topics.

posted at: 11:13 | path: /ML | permanent link to this entry
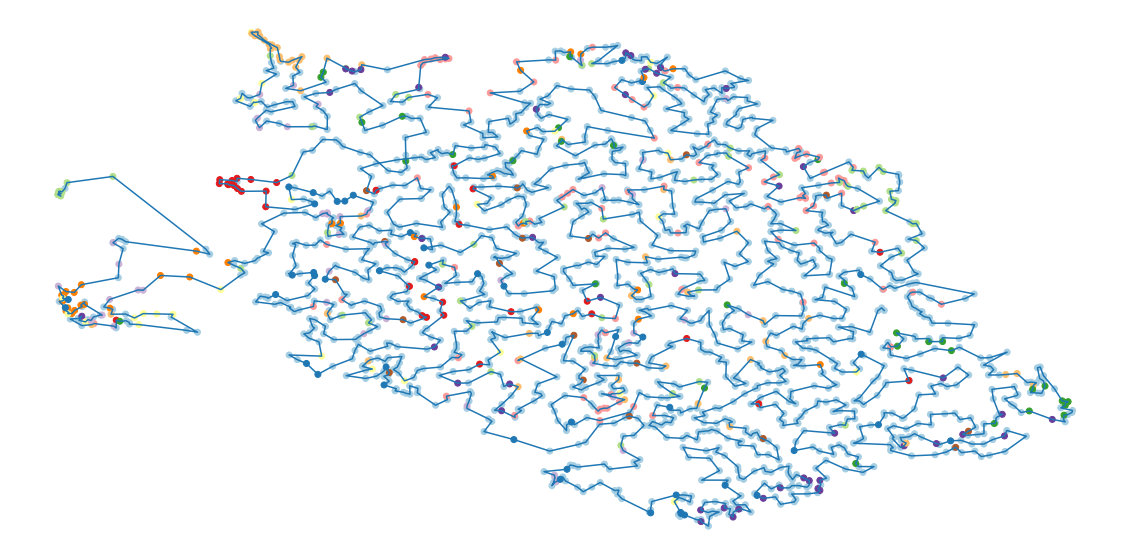
When I have a large pile of papers to read, in electronic form, I do not want to read them in a random order: I prefer to read related papers together.
How can we sort hundreds of papers by topic?
Let us take the example of the CVPR conference (more than 1000 papers). We will proceed as follows:
- Retrieve the abstract of all the papers;
- Compute the embedding of each abstract, using the DistilBert pretrained model, from HuggingFace's Transformers library;
- Reduce the dimension to 2, to plot the data, using UMAP (we could use t-SNE instead);
- Find an ordering of the papers, i.e., a path, minimizing the total distance in the UMAP-reduced space (we could compute the distances in the original space, instead), using ortools's TSP solver.
The result can be a text file with the paper titles, links and abstract, in the order, or a pdf file with the first page of each paper, in the order (you can also read the begining of the introduction, and enjoy the plot on the first page, should there be one).
posted at: 14:47 | path: /ML | permanent link to this entry
Here are some of the topics I found interesting at the recent ICLR 2020 conference.

While most neural networks are based on linear transformations and element-wise nonlinearities, one deceptively simple operation is at the core of many innovations (LSTM, attention, hypernetworks, etc.): multiplication.
The notion of gradient is omnipresent in deep learning, but we can compute several of them (gradient of the output or of the loss, wrt the input or the parameters), and they all have their uses.
There is an increasing interplay between classical algorithms (numeric algorithms, machine learning algorithms, etc.) and deep learning: we can use algorithms as layers inside neural nets, we can use neural nets as building blocks inside algorithms, and we can even put neural nets inside neural nets -- anything in a neural net can be replaced by another neural net: weights, learning rate schedule, activation functions, optimization algorithm, loss, etc.
Our understanding of why deep learning works has improved over the years, but most of the results have only been proved for unrealistic models (such as linear neural nets). Since there was also empirical evidence for more realistic models, it was widely believed that those results remained valid for general networks. That was wrong.
We often consider that the set of possible weights for a given neural net is Euclidean (in particular, flat) -- it is an easy choice, but not a natural one: it is possible to deform this space to make the loss landscape easier to optimize on. The geometry of the input and/or the output may not be Euclidean either: for instance, the orientation of an object in 3D space is a point on a sphere.
Convolutional neural networks look for patterns regardless of their location in the image: they are translation-equivariant. But this is not the only desirable group action: we may also want to detect scale- and rotation-invariant patterns.
Neural networks are notorious for making incorrect predictions with high confidence: ensembles can help detect when this happens -- but there are clever and economical ways of building those ensembles, even from a single model.
Supervised learning needs data. Labeled data. But the quality of those labels is often questionable: we expect some of them to be incorrect, and want our models to account for those noisy labels.
With the rise of the internet of things and mobile devices, we need to reduce the energy consumption and/or the size of our models. This is often done by pruning and quantization, but naively applying those on a trained network is suboptimal: an end-to-end approach works better.
Adversarial attacks, and the ease at which we can fool deep learning models, are frightening, but research on more robust models progresses -- and so does that on attacks to evade thoses defenses: it is still a cat-and-mouse game.
The conference also covered countless other topics: small details to improve the training of neural nets; transformers, their applications to natural language processing, and their generalizations to images or graphs; graph neural networks, their applications to knowledge graphs; compositionality; disentanglement; reinforcement learning; etc.
posted at: 11:33 | path: /ML | permanent link to this entry
I have not attended the NeurIPS conference, but I have spent a few weeks binge-watching most of it. Here are some of the topics I have found interesting.
If you want to read/watch something funny, check the following topics: What happens if you set all the weights of a neural network to the same value? What happens if a layer becomes infinitely wide? What happens if a network becomes infinitely deep? Is it really pointless to consider deep linear networks?
If you want to look at nice pictures, check the recent explorations of the loss surface of neural nets.
If you want something easy to understand, check the discussions on fairness.
If you want something new, check the new types of layers (in particular those corresponding to combinatorial operations), sum-product networks (which are more expressive than traditional neural nets), mesure-valued derivatives (a third way of computing the gradient of an expectation), the many variants of gradient descent, second-order optimization methods, perhaps also Fourier-sparse set functions and the geometric approach to information theory.
If you want applications to finance... there were almost none. There was a workshop on "robust AI for the financial services", but the corresponding talks were either rather empty or only had a thin connection to finance.
posted at: 14:30 | path: /ML | permanent link to this entry
Rather than a review of 2019 in machine learning, this is a review of (some of) what I read this year: this is biased towards my interests, incomplete, and some of the topics may already be a few years old.
1a. The main transformation in the machine learning landscape was undoubtedly the rise of language models: they are not only more powerful, trained on more data, they are also more directly usable, thanks to the HuggingFace transformers library.
https://huggingface.co/transformers/index.html
It is difficult, however, to keep track of which model is currently the best. When you read this, it may no longer be one of the following: BERT and its many variants (Albert (lightweight), RoBERTa (Facebook), DistilBERT, CamemBERT (French), Ernie (Baidu, Chinese), etc.), XLNet, XLM, GPT-2, etc.).
1b. Those models provide contextual word embeddings – in contrast to word2vec, GloVe, FastText, which are not contextual.
Visualizing and measuring the geometry of BERT
https://arxiv.org/abs/1906.02715

Contextual string embeddings for sequence labelings
https://pdfs.semanticscholar.org/421f/c2556836a6b441de806d7b393a35b6eaea58.pdf
1c. There has also been some work on multilingual models, in particular multilingual embeddings: for languages with less training data, one can simply learn a single model for several (related) languages.
Image search using multilingual texts: a cross-modal learning approach between image and text
https://arxiv.org/abs/1903.11299

https://github.com/facebookresearch/MUSE
1d. Some (traditional) word embeddings can account for polysemy.
Linear algebraic structure of word senses with applications to polysemy
https://arxiv.org/abs/1601.03764

Multimodal word distributions
https://arxiv.org/abs/1704.08424
2. "Self-supervised learning" is a special case of unsupervised learning (or a first, pretraining, step in semi-supervised learning, or pre-training for supervised learning) in which we turn the unlabeled data into a supervised problem. For instance, given unlabeled images, we can train a model to tell if two patches come from the same image. Given sound data, we can train a model to tell if two patches are close in time or not – the features learned will identify phonemes, if we want very close patches, or speakers, for slightly more distant ones.
posted at: 07:36 | path: /R | permanent link to this entry
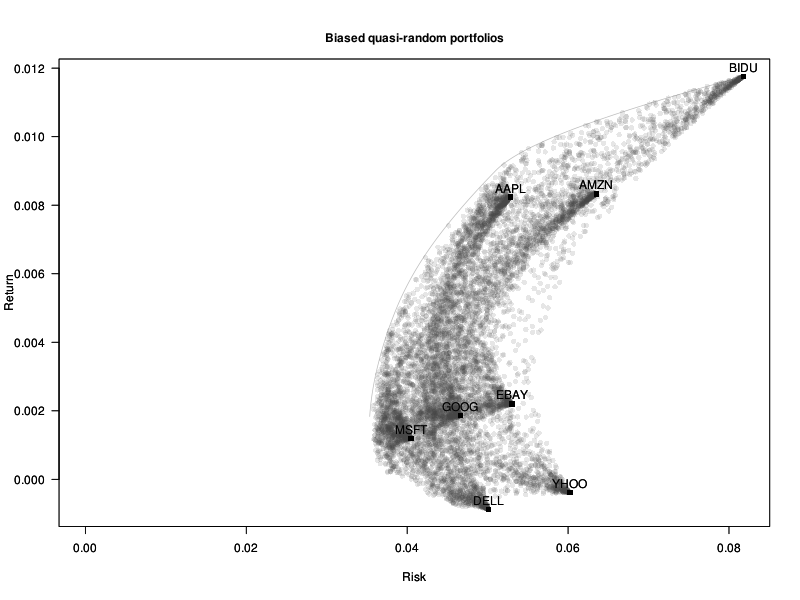
Many problems in statistics or machine learning are of the form "find the values of the parameters that minimize some measure of error". But in some cases, constraints are also imposed on the parameters: for instance, that they should sum up to 1, or that at most 10 of them should be non-zero -- this adds a combinatorial layer to the problem, which makes it much harder to solve.
In this note, I will give a guide to (some of) the optimization packages in R and explain (some of) the algorithms behind them. The solvers accessible from R have some limitations, such as the inability to deal with binary or integral constraints (in non-linear problems): we will see how to solve such problems.
When you start to use optimization software, you struggle to coax the problem into the form expected by the software (you often have to reformulate it to make it linear or quadratic, and then write it in matrix form). This is not very user-friendly. We will see that it is possible to specify optimization problems in a perfectly readable way.
# Actual R code
x <- variable(5)
minimize( sum(abs(x)) + sum(x^2) - .2*x[1]*x[2] )
x >= 0
x <= 1
sum(x) == 1
x[1] == x[2]
r <- solve()
Many of the examples will be taken from finance and portfolio optimization.
posted at: 15:18 | path: /R | permanent link to this entry
I did not attend the conference this year, but just read through the presentations. There is some overlap with other R-related conferences, such as R in Finance or the Rmetrics workshop.
http://www.agrocampus-ouest.fr/math/useR-2009/
http://www.rinfinance.com/
http://www.rmetrics.org/meielisalp.htm
Here are some more detailed notes.
posted at: 15:18 | path: /R | permanent link to this entry
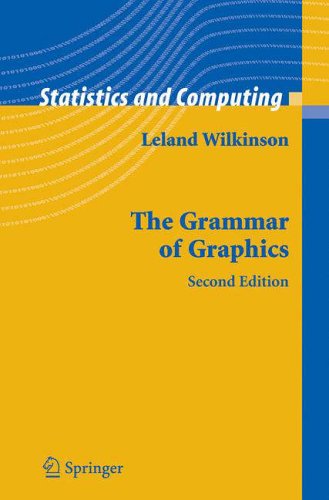
Though this book is supposed to be a description of the graphics infrastructure a statistical system could provide, you can and should also see it as a (huge, colourful) book of statistical plot examples.
The author suggests to describe a statistical plot in several consecutive steps: data, transformation, scale, coordinates, elements, guides, display. The "data" part performs the actual statistical computations -- it has to be part of the graphics pipeline if you want to be able to interactively control those computations, say, with a slider widget. The transformation, scale and coordinate steps, which I personnally view as a single step, is where most of the imagination of the plot designer operates: you can naively plot the data in cartesian coordinates, but you can also transform it in endless ways, some of which will shed light on your data (more examples below). The elements are what is actually plotted (points, lignes, but also shapes). The guides are the axes, legends and other elements that help read the plot -- for instance, you may have more than two axes, or plot a priori meaningful lines (say, the first bissectrix), or complement the title with a picture (a "thumbnail"). The last step, the display, actually produces the picture, but should also provide interactivity (brushing, drill down, zooming, linking, and changes in the various parameters used in the previous steps).
In the course of the book, the author introduces many notions linked to actual statistical practice but too often rejected as being IT problems, such as data mining, KDD (Knowledge Discovery in Databases); OLAP, ROLAP, MOLAP, data cube, drill-down, drill-up; data streams; object-oriented design; design patterns (dynamic plots are a straightforward example of the "observer pattern"); eXtreme Programming (XP); Geographical Information Systems (GIS); XML; perception (e.g., you will learn that people do not judge quantities and relationships in the same way after a glance and after lengthy considerations), etc. -- but they are only superficially touched upon, just enough to wet your apetite.
If you only remember a couple of the topics developped in the book, these should be: the use of non-cartesian coordinates and, more generally, data transformations; scagnostics; data patterns, i.e., the meaningful reordering of variables and/or observations.
posted at: 15:18 | path: /R | permanent link to this entry
I have just uploaded the new version of my "Statistics with R":
http://zoonek2.free.fr/UNIX/48_R/all.html
The previous version was one year and a half old, so in spite of the fact I have not had much time to devote to it in the past two years, it might have changed quite a bit -- but it remains as incomplete as ever.
posted at: 15:18 | path: /R | permanent link to this entry
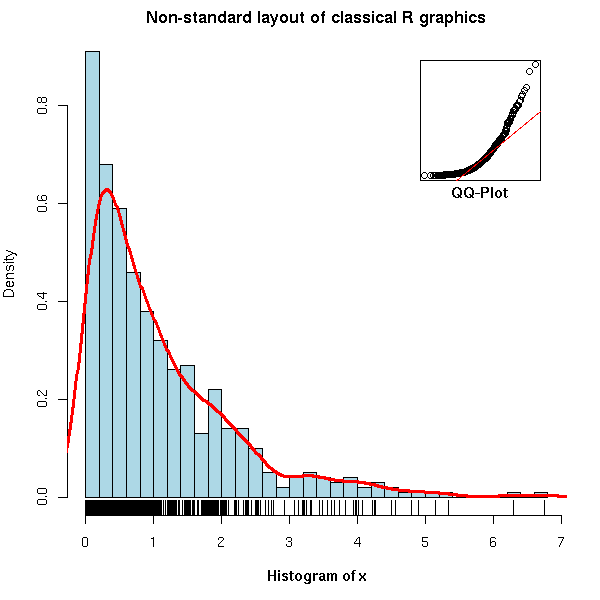
I just finished reading Paul Murrel's book, "R graphics".

There are two graphical systems in R: the old ("classical" -- in the "graphics" package) one, and the new ("trellis", "lattice", "grid" -- in the "lattice" and "grid" packages) one.
The first part of the book, devoted to the old system, tries to be as complete as a reference book, but fails. For instance, the discussion on how to arrange several plots on a single page sticks to tabular layouts and fails to mention the more flexible "fig" graphical argument (to be honest, it is listed with terser explanations than in the manual page and also appears, deeply hidden in an example, in an appendix).
op <- par(mar = c(5,4,2,2))
N <- 500
x <- rexp(N, 1)
hist(x,
     breaks = 30, probability = TRUE,
     col = "light blue",
     xlab = "",
     main = "Non-standard layout of classical R graphics")
mtext(text = "Histogram of x",
      side = 1, font = 2, line = 3)
lines(density(x),
      col = "red", lwd = 3)
rug(x)
par(new = TRUE,
    fig = c(.7, .9, .7, .9),
    mar = c(0,0,0,0))
qqnorm(x,
       axes = FALSE,
       main = "", xlab = "", ylab = "")
box()
qqline(x,
       col = "red")
par(xpd = NA)
mtext(text = "QQ-Plot",
      line = .2, side = 1, font = 2)
par(op)
On the other hand, the second and largest part, devoted to grid graphics lives up to my expectations: it seems more complete and does not duplicate information already available on the web. You are probably already familiar with some of the high-level lattice plots (xyplot(), histogram(), bwplot()), but if you have already tried to understand how they are implemented, or tried to write your own graphical functions, you were probably confused by the differences (and claimed lack thereof) between "lattice", "panel", "grob" and "grid" -- the book clarifies all that.
The code of the examples in the book is available on the author's web site.
http://www.stat.auckland.ac.nz/~paul/RGraphics/rgraphics.html
You will find, for instance, dendrograms (check the rpart and maptree packages),
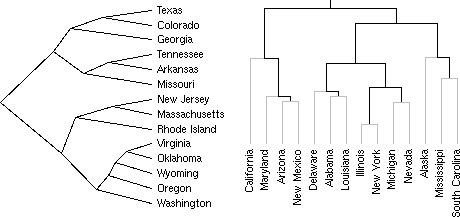
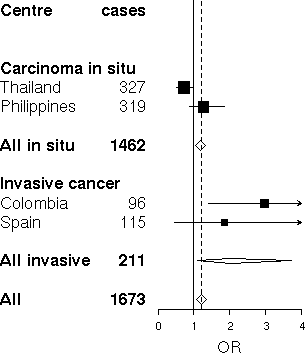
table-like plots
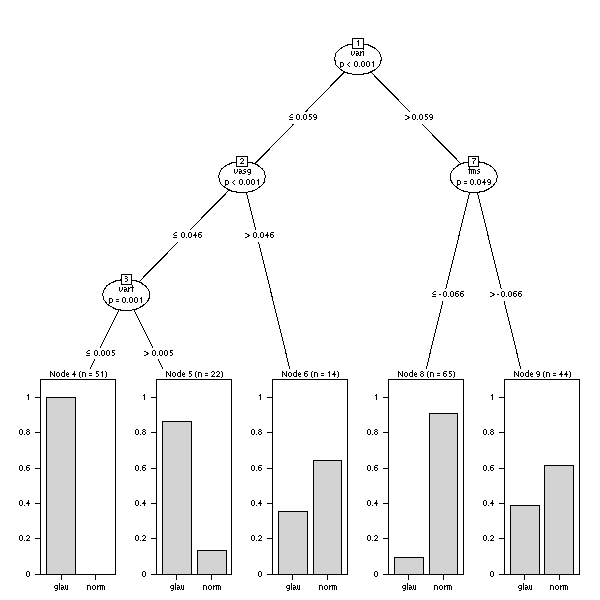
or plots arranged in a tree (this can be seen as a generalization of lattice plots, that present several facets of a dataset arranged on a grid).
One whole chapter is devoted to the creation, from scratch, of an oceanographic plot
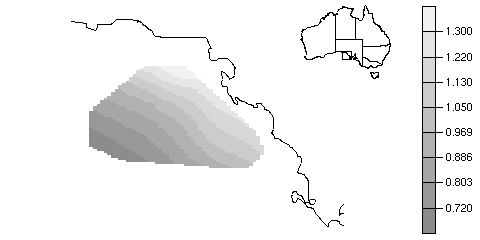
whose elements are then reused for a completely different plot.
posted at: 15:18 | path: /R | permanent link to this entry
Last week, I attended the 2006 UseR! conference: here is a (long) summary of some of the talks that took place in Vienna -- since there were up to six simultaneous talks, I could not attend all of them...
In this note:
0. General remarks
1. Tutorial: Bayesian statistics and marketing
2. Tutorial: Rmetrics
3. Recurring topics
4. Other topics
5. Conclusion
For more information about the contents of the conference and about the previous ones (the useR! conference was initially linked to the Directions in Statistical Computing (DSC) ones):
http://www.r-project.org/useR-2006/
http://www.ci.tuwien.ac.at/Conferences/useR-2004/
http://www.stat.auckland.ac.nz/dsc-2007/
http://depts.washington.edu/dsc2005/
http://www.ci.tuwien.ac.at/Conferences/DSC-2003/
http://www.ci.tuwien.ac.at/Conferences/DSC-2001/
http://www.ci.tuwien.ac.at/Conferences/DSC-1999/
I attended two tutorials prior to the conference: one on bayesian statistics (in marketing) and one on Rmetrics.
There were 400 participants, 160 presentations.
Among the people present, approximately 50% were using Windows (perhaps less: it is very difficult to distinguish between Windows and Linux), 30% MacOS, 20% Linux (mostly Gnome, to my great surprise).
posted at: 15:18 | path: /R | permanent link to this entry
Some of the pictures I took last year...

posted at: 15:18 | path: /Pictures | permanent link to this entry
I just came back from holidays. Last time I went to Japan, I had visited Tokyo, Kyoto, Osaka, Nara, Kobe, Hiroshima, Himeji, Otsu. This time I went to Kyoto (Arashiyama), Okayama (excellent tofu, unimpressive castle), Koya-san (impressive graveyard, in the forest), Miho (a museum more interesting than its contents), Osaka (its aquarium, its open-air museum of old farm houses), Nagoya (its castle, its orchid museum, its ceramics museum), Tokyo, Kamakura (interesting hiking courses), Yokohama (disappointing), Nikko (freezing), Sendai (full of unhelpful touristic indications), Matsumoto (very nice castle, with the Alps as a backdrop).

Here are a few more pictures.
posted at: 15:18 | path: /Pictures | permanent link to this entry
Some pictures from my recent trip to Hokkaido...

posted at: 15:18 | path: /Pictures | permanent link to this entry
I bought a new camera, a digital SLR.
Follow me as I discover the (meaningful?) differences between an SLR and a compact, as I experience the unreliability of high-end digital products, as I suffer from the desire of camera manufacturers to limit what we can do with our photographs ("prevents us from using non-bona-fide software").
posted at: 15:18 | path: /Pictures | permanent link to this entry
This week-end, I finished reading the articles of the WEIS 2006 (Workshop on the Economics of Information Security) -- I like conferences whose proceedings are available online: I can learn a lot, without spending a penny, even in domains which are not my primary focus.
http://weis2006.econinfosec.org/prog.html
A couple of them were finance-related (I currently work for an asset manager):
- Privacy breaches are a source of information that can help predict the future stock prices of the company -- but only in the short term: the effect vanishes quickly.
- "Information on (yet) undisclosed vulnerabilities" is a traded asset, with three main markets: government agencies, software vendors, underground market.
- Stock spam works: the stocks do exhibit short-term positive returns -- but beware, these are penny stocks, with no liquidity: no one but the spammer can invest in them early enough (the positive returns are actually a consequence of the lack of liquidity when naive spammed people try to invest).
Many focused on cyber-security investment in companies, either providing a mathematical cost-benefit analysis and drawing conclusions or presenting survey results about current practices.
- In most companies, cyber-cecurity investment does not rely on a rigorous cost-benefit analysis process.
- If you do not have much to lose, do not invest in security (at all); if you do, do not invest too much: recovery procedures are also important.
- The fair price of IT security can be as high as the price of the data/systems/processes to be protected.
- Firms are decreasing their security budget to ensure Sarbanes-Oxley (SOX) compliance.
- Systems (software, company networks, etc.) with better levels of protection have stronger incentives to reveal their security characteristics to attackers than poorly protected systems.
- (Small) companies with a TRUSTe certificate are less reliable than those without.
- Software vendors should be held liable for software faults.
- There was also a study of internet outage in manufacturing: the effects depend on what the company does when no information comes in: either produce and ship as usual (fine) or wait for orders (disastrous -- this is the case of the automobile industry)
Graph theory:
- Strategies to make a network resilient to attacks, mainly centrality attacks: split large nodes into rings (does not work) or into cliques (better), delagation (a large node selects two of its neighbours, connects them, and disconnects from one -- does not work), or cliques+delagation (even better).
- When you monitor someone (in a social network), you also monitor the people he interacts with -- conversely, to monitor someone, you can start to monitor the people around him.
There was also a non-graph-theoretic, algorithmic article, about Distributed Constraints Optimization (DCOP), i.e., calendar problems when you do not want to divulge your availability or preferences to the person who need to schedule an appointment with.
A couple of articles focused on privacy issues.
- Opt-out schemes provide higher welfare than anonymity, which is better than opt-in -- but the article stops there. This actually calls for a fourth option, e.g., "privacy-enhanced data mining".
- The opposite of privacy is (price) discrimination.
An article reminded the reader that users exist and are lazy: if you want them to fix problems, fixes should be easy to do and/or low-cost.
An article detailed consequences of lack of interoperability: proprietary storage formats on mobile phones hinder forensic investigations.
An article examined the non-adoption of secure internet protocols (HTTPS, DNSSEC, IPSec, etc.): for people to start using them, they have to already be in use -- they have to be bootstrapped. (HTTPS went fine only because it was imposed by credit card companies, but failed to completely replace HTTP.)
posted at: 15:18 | path: /Misc | permanent link to this entry
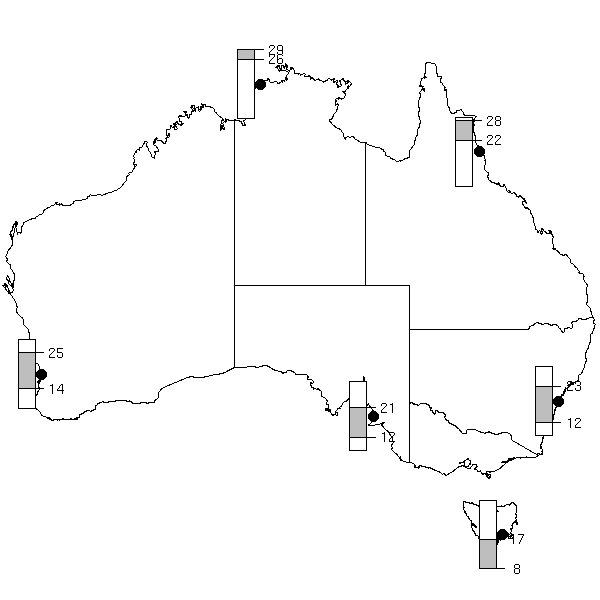
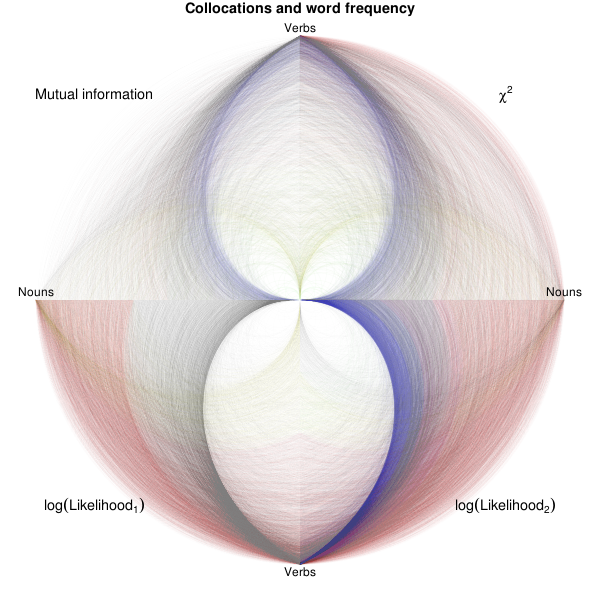
Learning a foreign language is time-consuming.
If you were learning English as a foreign language, you would have a wealth of resources at your disposal. You would be using monolingual dictionaries built with a controlled vocabulary, not unlike Wikipedia's "simple English", i.e., the definitions would use a limited set of 2000 words, assumed to be known by the users, with exceptions dutifully highlighted. You would be provided with sample sentences, showing in which context and with which grammatical structure words should be used. You would also have lists of collocations -- collocations are pairs of words that often appear together: you can think of them as "minimal sample sentences".
For other languages, the learning materials are less adequate.
In this note, we will see how to automatically generate some of those missing resources, taking Japanese (and sometimes English) as an example.
posted at: 15:18 | path: /Linux | permanent link to this entry
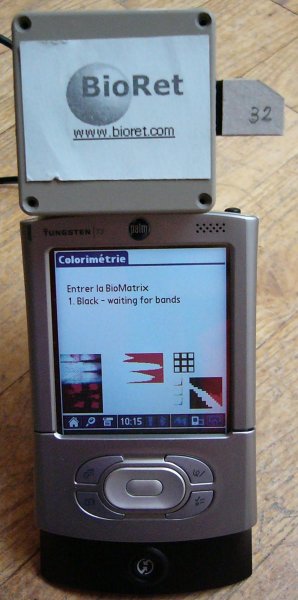
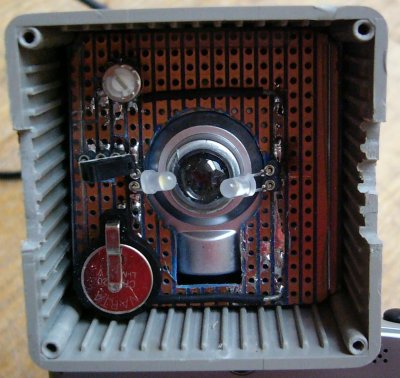
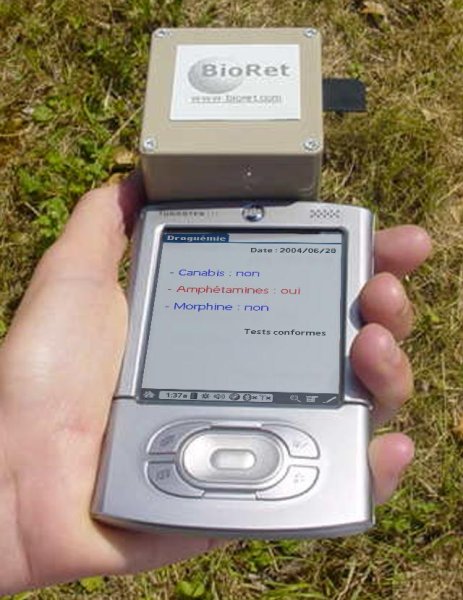
The company I used to work for, BioRet, closed.
http://www.bioret.com/
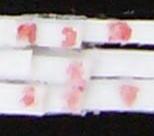
A start-up at the frontier between between biology, electronics and optics, we were designing "biochip readers". One can do biological analyses in the field, one at a time, on in the laboratory, thousands at a tiome: but there was nothing in the middle, no means of easyly performing dozens of tests in the field. The biologists in our team were designing the biochips -- they looked like miniaturized versions of the bands currently used for tests in the field, but the size changes the physico-chemical phenomena. The opto-electronitians were designing the artificial retina (something between the CCD of digital cameras and the processor in a computer, a light captor with computing power -- it is called a CMOS). My work, at the time, was to develop (to program) a proof-of-concept, built from a PDA with a digital camera. We had a small version (only three tests, each done twice, plus three control tests) of a biochip, but no artifical retina had been produced.

Why did we fail?
The project was too innovative -- Entrepreneurs beware: do not try to be innovative in France! (This is not a joke: when we explained our project to potential customers, partners or investors, their immediate reaction was: "why are you so innovative? Why don't you try some more classical, less efficient but less risky methods?".)
The project was at the frontier between several domains, therefore investors, specialized in only one of these domains, had problems understanding, assessing, trusting our ideas.
The project was also too ambitious: developping a chip is probably too ambitious for a start-up.
The prototyping of the application on the PDA to read the biochip was done in R (on Linux): I had implemented a few image processing algorithms ("mathematical morphology"). In case someone is interested, here is the code (distributed under the GPL)
http://zoonek2.free.fr/UNIX/48_R/morphology.R
and here is some documentation (with a lot of pictures, as always), in French.
http://zoonek.free.fr/Ecrits/2004_BioRet.pdf.bz2
http://zoonek2.free.fr/UNIX/48_R/Rapport_final_morphologie.Rnw
posted at: 15:17 | path: /Misc | permanent link to this entry
I decided to reinstall Gentoo Linux on my computer, but this time I wanted the whole drive to be encrypted -- including the system partition and the swap, and not only the data partition, as before. Among the other non-standard details, I also have a Wacom tablet and want to be able to type Japanese text. I proceeded as follows (if you do not want that much encryption, just use the livecd: you have a complete, useable system in less than one hour, instead of one or two days).
posted at: 15:17 | path: /Linux | permanent link to this entry
Programmers should learn a new programming language every year -- not necessary to ditch the one(s) they are currently using, but we might glean new ideas, new programming paradigms and a more informed, objective, critical view of the programming landscape and its latest fads. In the past few months, I "learned" three of them (it might sound a lot, but because of lack of time, my survey remained very superficial): Oz, Erlang and Chuck.
posted at: 15:17 | path: /Linux | permanent link to this entry
Since I decided to revive my web page, to update it on a more regular basis, to resume a frequent web activity, I have a look at a couple of Blog engines. I want one that allows me to write in a text editor, not in a web browser, that allows me to type text, not HTML, that allows me to use my own (pre-wiki) tagging, that produces static files.
Most blog engines are dynamic (meaning that the contents are stored on the web server, as text files or inside a database, and that the actual HTML pages are only generated when requested), but Blosxom (and probably PyBlosxom, its Python cousin, as well) also allows for the generation of static web sites (i.e., we can generate all the HTML pages at once and only transfer them to the web server).
posted at: 15:17 | path: /Linux | permanent link to this entry
Since I had not learnt a new programming langage for years (the previous one was Ruby, three years ago), I decided to try a new one: Haskell. It is a functionnal language, i.e., one keeping the good ideas of Lisp and forgetting the awful syntax -- Lisp is still being used, in domains where, in spite of its excessive use of parentheses, it keeps an edge on easier programming languages -- for instance in computer music. Haskell often wins the ICFP contest, which is not limited to functional languages.
http://www.amazon.com/Notes-Metalevel-Studies-Music-Research/dp/9026519753
http://en.wikipedia.org/wiki/International_Conference_on_Functional_Programming_Contest
http://linuxfr.org/2007/01/11/21899.html
Other marginal (i.e., not yet mainstream) languages one might want to learn are OCaml (another functional language, as fast as C or C++ according to the programming languages shootout and used in some real-world applications, e.g., in finance), Erlang (another functional language, developped and used by Ericson, that allows you to write multi-threaded or even distributed applications without really thinking about it) or Squeak (a Smalltalk offspring, that prominently features in the OLPC (One laptop per child) initiative).
http://www.galois.com/cufp/slides/2006/YaronMinsky.pdf
http://shootout.alioth.debian.org/
http://www.algorithm.com.au/downloads/talks/Concurrency-and-Erlang-LCA2007-andrep.pdf
http://www.squeak.org/
http://linuxfr.org/2007/01/06/21860.html
Here are the notes I took while learning Haskell.
posted at: 15:17 | path: /Linux | permanent link to this entry
After ditching Mandriva because my machine was becoming slower and slower (instead of faster and faster), after experiencing serious latency problems while trying to watch videos on Suse, after straining my eyes on Ubuntu (I do not remember if it was because of the fonts or because I was desperately looking for a useable application), I finally turn to Gentoo.
It is a very different breed of distribution: everything is compiled from source, so that you install only the applications you need and you can fine-tune the compile flags for them (distributions on CDs are often compiled with -Os so as to minimize disk space -- this might not be what you want). It also gets rid of the patent-related problems.
That sounds very appealing, but be warned: should you decide to install this distribution, you must have several days in front of you, you must not be afraid of the command line, you must not be bewildered when you are told that the system is "finally installed" even though there is no media player, no web browser, no KDE, no Gnome, no word processor, no X -- yet.
posted at: 15:17 | path: /Linux | permanent link to this entry
Ubuntu was the next stop on my journey away from Mandriva. Though the distribution has a very good reputation, though it is touted as rock-solid and easy-to-use even for beginners, it left my computer in an appalling state: it is of course plagued by the patent-induced lack of media players that infects more and more distributions, but the rare present applications lacked most of the features, most of the appeal of their KDE counterparts. Even worse, the distribution failled to install -- a power-user will manage to fix things, but the begininners, the very target of this distribution, will throw the CDs in the bin.
While you might keep Gnome alongside KDE on your computer, for the rare worthy applications (Gimp, Gnumeric) and to keep an eye on the competitors, Ubuntu is, for me, a no-go.
posted at: 15:17 | path: /Linux | permanent link to this entry
Following my problems with Mandriva 2006, I start looking around for other Linux distributions. First on my list is Suse.
posted at: 15:17 | path: /Linux | permanent link to this entry
I have been using Mandriva (formerly known as Mandrake) for several years, but I am less and less happy with it. I usually reinstall the system twice a year, in order to have (the impression to have) a brand new, faster computer each time: here are the notes I took during the latest (last?) install -- and the reasons why I am drifting away from this distribution.
posted at: 15:17 | path: /Linux | permanent link to this entry
Here are the notes I took while installing Mandrake 10.1 (well, actually, it is a slight rewriting of the previous notes).
posted at: 15:17 | path: /Linux | permanent link to this entry
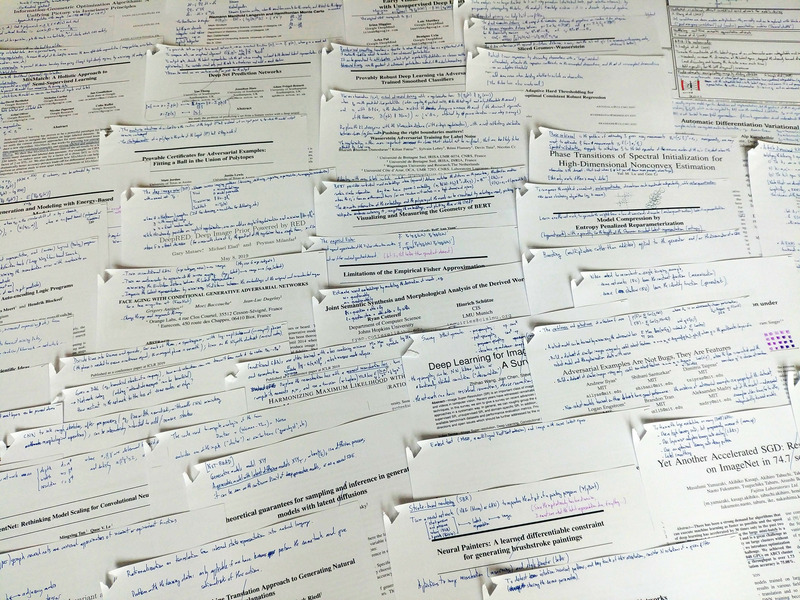
Before changing jobs and moving, a few months ago, I cleaned my desk and read through (some of) the piles of papers that were cluttering it. The interesting articles I stumbled upon covered some of the following topics.
- Which probability distribution should I use to model asset returns?
- Regression algorithms work fine when the variable to predict is observable, when it is known on the training sample -- what can you do if only its long-term effects are observed?
- Principal component analysis (PCA) is often used with time series but completely forgets the time structure and potential time dependencies: is it possible to have a "dynamic PCA"?
- How can Markowitcz's efficient frontier be generalized to other (several) measures of performance and risk?
- Can expected utility theory account for psychological biases such as the desire for negative expected gains if potential gains are very large (as in lotteries)?
- Options also occur in the real (non-financial) world and option pricing leads to a (not so) surprising conclusion on the (higher) value of free software.
posted at: 15:17 | path: /Finance | permanent link to this entry
At work, I have to deal with temporal data on a daily basis (pricing data are almost-regular time series, company or analysts announcements are irregular time series), with huge volumes of data, but I have always had a hard time doing so, because of the lack of a decent, useable time series or temporal database management system. The free software offer is almost void, the commercial software offer is limited to marginal, old, badly documented and/or downright frightening systems (Kx, Caché, FAME, FAST, etc.). What is wrong? What are the needs, the problems? Why aren't they solved? In the meantime, what can we do?
posted at: 15:17 | path: /Finance | permanent link to this entry

Most finance books (especially those that do not focus on options) are written in a sloppy, approximate, non-rigorous way, sometimes going as far as assuming that the reader has no idea what a matrix is and is unable to ever understand that notion, which is not only rude but also leads to needlessly horrible formulas that you have to translate into matrices when you want to implement the ideas on your computer.
To that regard, Meucci's book is refreshing: while very easy to understand (should you want it, you can even skip all the formulas, if you do not want the details and do not want to implement the procedures described), it remains rigorous, gives all the details you need to be convinced of the correctness of its assertions and highlights all the traps people tend to fall into.
posted at: 15:17 | path: /Finance | permanent link to this entry
